

Who are you betting on: the jockey or the horse? If you’re considering a passive investment in a syndicated real estate deal, you’re grappling with this question right now. Or you should be.
I’m well into my third decade as a real estate investor. My firm professionally invests in real estate syndications. It’s all we do.
For the most part, my team emphasizes the jockey first. We believe a great management team can turn around most mediocre properties. Similarly, a bad team can ruin almost any great property.
Consequently, we don’t bother looking at a property until we trust the management team. Whitney Elkins-Hutton did a great job covering this issue in “How to Evaluate Real Estate Syndication Sponsors.”
Be that as it may, you would be foolish to ignore the real estate within any syndication offering.
Warren Buffett, perhaps the greatest investor of our time, in his 1989 shareholder letter said: “Good jockeys will do well on good horses, but not on broken-down nags.”
Here’s a brief overview on how to evaluate the real estate inside a syndication for prospective investors.
Market Analysis and Real Estate Basics
You’ve heard the saying “location, location, location” regarding residential real estate. For commercial real estate, I recommend broadening your approach from simply the location to the market as a whole.
When acquiring a home, you will probably consider the area’s safety and proximity to schools, work, and recreation. An investor in syndicated commercial real estate may evaluate these factors, and a lot more.
Commercial real estate investors typically seek both predictable income and appreciation, so start by categorizing the most important factors that could promote or constrain the income and appreciation potential for the property you’re evaluating.
Here are a few examples:
- Is this real estate sector (multifamily, self-storage, mobile home parks, hotels, retail, industrial, etc.) in high demand? Does current supply in that location meet demand? What factors (like legal, regulatory, tax, and sector reputation) could impact this sector?
- What class (A, B, C, D, or less) is this property (and the surrounding neighborhood)? Can the property be upgraded to a better class? How is that class performing now, and does the underwriting reflect this?
- What is the syndicator’s strategy, and does their underwriting, experience, and debt and equity structure support this? (Strategies may include development, buy and hold, buy and flip, and more.) Does the market for this asset type, with this quality, in this location, support this strategy?
Evaluating a property starts with a “top-down analysis.” Before looking closely at the property, evaluate the macroeconomic factors that will likely drive success (or seal failure) of this investment. These could include:
- Population growth (compared to the nation and the region—often expressed as net migration)
- Job growth (are employers coming to the area?)
- Diversity of employers (I like to see a mix of industry, tech, government, and education.)
- Income growth (Specifically, do incomes in the area support your specific property’s strategy?)
Some key indicators to dial in on when evaluating a market may include:
- Construction/absorption ratio
- Rent growth
- Market vacancy/long-term vacancy average
- Rent-to-ownership cost ratio
- Income-to-housing cost ratio
Property-Level Analysis
While our market analysis utilized a top-down approach, we will evaluate the property using a bottom-up approach. This approach analyzes the fundamental details of the property that exist, regardless of market conditions or the economy. The property-level analysis will also review how this property compares to competitors.
Let’s start with some location qualities typically critical to a property’s success. These factors could weigh more heavily for certain property types than others.
For example, consider the importance of the first few items for a retail center versus a mobile home park or warehouse:
- Visibility
- Traffic count
- Access to transportation
- Amenities
- Walkability Score (see walkscore.com for examples)
- Crime rate (compare to national and local averages, and weigh the type of crime)
- School district
- Demographics
You will also want to check the syndicator’s market study and rent comparables carefully. This may surprise you (I’m joking), but they will almost always paint the property in the most favorable light.
How do you solve this? Do your own study. Thankfully, tools like Google Earth/Maps and a host of other tools will allow you to do most of this analysis in your pajamas from your kitchen table.
But don’t stop there: Make calls. Check occupancies (it’s tough to get that one). Check demand at the competition and your subject property. Critically ask yourself and the syndicator about their plan to achieve the rent and occupancy increases they will certainly tout in their marketing literature.
When you’re doing this, remember that syndicators often make confident assertions about highly uncertain future events. Believe them if they say the sun will rise in the east tomorrow. Question them if they assert that they will raise rents by $250 and occupancy by 5% in the next year.
Put your skeptic’s hat on. I hate to say it, but assume they may be lying and make them (and the numbers) prove themselves.
There is so much nuance and wisdom required here. For example, consider that leases are typically 12 months, and renovating interiors and raising rents all at once is impossible.
Also, think critically about economic occupancy (defined later). It’s usually exaggerated, especially by unsophisticated newbies. Virtually no one can maintain 95%-plus economic occupancy (how much rent you collect, compared to the theoretical maximum given by the market rate, multiplied by number of units).
And beware of syndicators trying to focus only on rent per square foot. While this is a valid comparison, it is far less important than comparing overall rents by numbers of bedrooms and baths.
There are so many other factors to be aware of. This is why your choice of an experienced professional syndicator (the jockey and their documented track record) should precede the property (the horse) analysis. And this is punctuated by asking the principals to confirm they are risking their own cash (not just a fee they invest back in the syndication) as part of the deal.
Financial Analysis
If you’re investing in a syndication or fund, you’re probably looking to get something in return. Some investors want income. Others want appreciation. Most want both.
Whether you like it or not, you (or someone you trust) should carefully analyze the financial projections before (and after!) investing.
It’s critical to find out if the syndicator’s projected returns are conservative, achievable, or flat-out pipe dreams. There’s too much to cover here, so I will try to briefly touch on some of the statements you will need to become familiar with:
- Income (or “operating”) statement: Income is quantified and analyzed by detailing gross revenue and operating expenses item-by-item here. Trailing income statements detail the past; pro formas project the future.
- T-12: This is industry jargon for “trailing-12-month income statement.” It shows financial performance for each of the past 12 months.
- T-3: This is similar to T-12, but it takes the past three months of data and annualizes it for a full year. The T-3 can often demonstrate trends—is the property getting better or worse?
- T-1: A more granular version of T-3, this time annualizing the current month’s income.
- T-3/T-12 or T-1/T-12: A very common way to get a true picture of trending financials is to use T-3 (or T-1) income and T-12 expenses. Why? Because it can be helpful to compare trending income to a whole year of expenses, which tend to be more seasonal (think air conditioning in Phoenix or snow removal in Buffalo).
There is so much to understand about these statements, and it is beyond the scope here to explain each line. I recommend you order Brian Burke’s outstanding book The Hands-Off Investor (BiggerPockets Publishing, 2020) to learn more.
Here is a snapshot from his book showing a sample income (operating) statement:
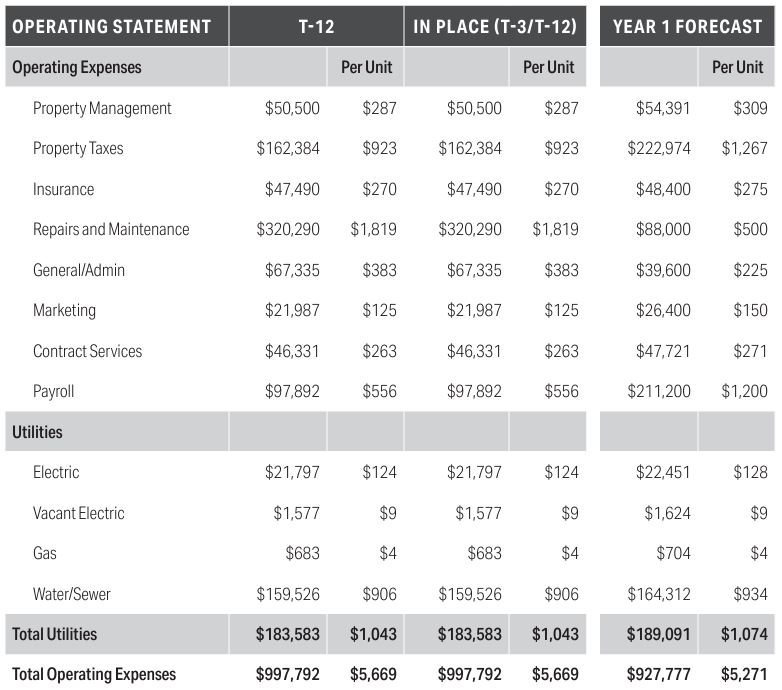
Note that it can be easy for beginners to believe that net operating income directly correlates to cash flow (which could end up in investors’ pockets). Investors also need to understand the cash flow forecast as well.
This statement starts with net operating income, deducting important items like debt service (interest and principal on debt), replacement reserves (funds set aside for future capital expenses), other lender-mandated reserves, and the syndicator’s asset management fee (don’t miss this one). The result is the after-debt cash flow.
Here’s another example from Brian’s book:
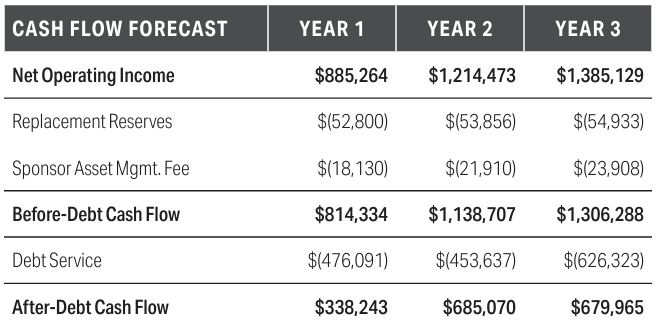
Are you convinced this is a great syndicator and property? As you consider an investment, you’ll need metrics to compare it to other opportunities you’ve been presented with. Later, when you want to keep tabs on it, you will want to track these key metrics to see if they’re hitting their numbers.
Here are some performance metrics for your consideration. They are divided into primary (like a speedometer—showing the direct results of your investment) and secondary (like a tachometer—measuring ongoing safety and performance along the way) categories.
Primary metrics
- Average annualized returns (AAR): Calculated as (total profit ÷ amount invested)/# of years.
- Internal rate of return (IRR): The discount rate that makes the net present value of all cash flows equal to zero. What IRR really does for you is calculate a return that takes into account both positive and negative cash flows, as well as the timing that you receive those cash flows.
- Cash-on-cash return: A measure of the actual cash received, divided by the cash that remains committed to the investment. (This is a measure of cash flow from operations.)
- Equity multiple: A numerical expression of how much you have, multiplied by the cash you invested.
You may be frustrated with my definition of IRR. I am too. There are many versions of IRR. Plus, many assumptions transcending the scope here. Some consider IRR the gold standard, since it accounts for profit and timing. While it’s quite valuable, like every metric, it needs context.
You may be tempted to compare the metrics of various deals without context. That could be a big mistake. This is another reason you need wisdom and experience.
Here’s a quick example: Our operating partner acquired an underperforming mom-and-pop mobile home park for $7.1 million (with ~ 50% debt) on the eve of the 2020 COVID-19 pandemic lockdowns. Within a week, he was offered $9.5 million. (I voted to take the money and run!) He wisely refused the offer and began improvements.1
Within nine months, he had achieved many operating and financial goals and was surprised to get an offer of $15 million. He closed the sale in December, exactly 10 months after the acquisition.
Between the cash flow and sale, the gross IRR on the equity was a whopping 347%. But if he had sold for the original $9.5 million offer and closed after holding for a month, the IRR would have been 2,983%! And the ARR would have been very high as well.
But would that quick sale have been a better deal for investors? Almost every investor on the planet would say no. The prospective short (say, one-month) hold significantly skews the metrics.
And that’s not all: The actual 10-month hold also skewed the metrics a lot, too. This IRR was amazing, the best I’ve ever received.
But let’s look at this more deeply: What if he had held it for 10 years, expanded the park, and sold it for $20 million? In that case, the IRR on equity may have been “only” about 10.9% (depending on ongoing cash flow). And the AAR would have been much lower than we experienced as well.
So would that have been an inferior deal? One would think so if only comparing metrics. However, many investors, including me, would typically prefer the 10-year hold with lower AAR and IRR, but a higher total cash return (and less hassle).
Context matters. And investors need to consider the effort and risk involved in finding replacement investments when an asset is liquidated. Wisdom and experience are helpful here.
Secondary metrics
- Break-even occupancy: The economic occupancy resulting in zero cash flow.
- Default ratio: The percentage of a property’s effective gross income, where income equals costs (breakeven).
- Debt service coverage ratios (DSCR): Ratio of net cash flow from operations to debt service (principal plus interest on periodic loan payments). (This is one of my favorite ratios because it measures safety, performance, direction over time, and more.)
- Expense ratios: There are many. For example, the operating expense ratio (OER) is the ratio of operating expenses to effective gross income.
- Physical occupancy (vacancy): The percentage of units rented (vacant).
- Economic occupancy (vacancy): This is similar, but accounts for concessions, “loss-to-lease,” and delinquent accounts.
Debt and Capital Structure
Debt: Is it a profit-generating friend? Or a fortune-wrecking foe?
Yes. More specifically, it depends.
The use of debt to invest in real estate is as common as water and as old as the hills. Many CRE syndicators believe their business can’t run without it. In all my years as a real estate investor, I’ve rarely seen a commercial syndicator who doesn’t routinely employ debt. This means it’s crucial that you learn to critically evaluate the use of debt in the syndications you invest in.
If you’re not convinced, here are a few thoughts. The use of debt in the past expansion cycle (2010 to 2022) allowed passive investors to make up to four times the profit they would have made on the same deal acquired with cash. As cap rates compressed and values skyrocketed, highly leveraged deals provided investors and syndicators with extraordinary profits.
However, the overheated market in this expansion cycle caused syndicators to increasingly rely on short-term, floating-rate debt to make competitive deals pencil. These loans typically provided a much lower rate, since the borrower assumed the risk of interest rate hikes.
Renewable interest rate caps provided reasonably priced insurance. And floating-rate debt avoided stiff prepayment penalties, giving them the opportunity to resell assets for a quick profit.
Sadly, for many, the lessons of the Great Financial Crisis had been forgotten or ignored. The Fed’s sharp, repeated interest rate hikes caught many syndicators off-guard. Debt service costs ballooned, and rate cap replacement costs skyrocketed. Many oblivious passive investors have faced paused distributions and capital calls. Others have faced foreclosure, and it’s likely many more will.
It’s important to note that the current troubles in CRE (specifically in multifamily, self-storage, and a few more) are almost always caused by debt. Many of them are operating quite well, or would be if their syndicators weren’t distracted trying to save their deals.
The medium- and long-term demographic demand for multifamily appears to be very strong. So we can often look to debt as the culprit. (Note that issues in the office asset type are more structural in nature, resulting in their own set of problems.)
When evaluating floating-rate debt in a syndication, stress-test the impact of interest rate hikes, interest payment reserves, rate cap replacement reserves and costs, and more.
Reportedly, judicious floating-rate debt is less costly than fixed-rate debt most of the time. But don’t forget the story of the six-foot-tall man who drowned crossing a four-foot-deep river: He failed to realize the river was four feet deep on average. It’s critical to account for the impact of changing economics when using any debt, because debt is the No. 1 killer of most deals that go south.
When evaluating any debt, look closely at the LTC (loan-to-cost ratio), the DSCR, and ratios such as the break-even analysis. And don’t let the syndicator’s confident boasts fool you into believing the numbers will only get better. Let their track record be your guide.
Also look closely at when the debt matures. Three years is a blink of an eye in the CRE space, and if the loan matures (must be paid off) in three years, the market might be unsupportive of a sale or refinance then. This could cause the property to wind up in foreclosure, sell at a loss, or sell at an inopportune time, for far less profit than expected. Five-, seven-, or 10-year maturities provide a wider margin here, allowing time to sell at the next market cycle peak if an adverse market comes along.
Commercial loans typically have shorter terms than residential loans. While residential loans typically span 15 or 30 years, fixed-rate commercial loans usually have a five-to-12-year term.
Like residential loans, these same commercial loans are often amortized over 30 years. Some start with an interest-only period, or even provide interest-only payments for the term of the loan. Many commercial loans are assumable—others have prepayment penalties.
Prepayment “penalties” on commercial loans compensate the lender for the lost interest they expected to receive at the loan’s commencement. These may take the form of defeasance or yield maintenance. Defeasance is a complicated structure that effectively reimburses the lender through acquiring securities (such as Treasury notes) and more. This can be very costly for the borrower/syndicator.
Yield maintenance requires the borrower to pay the lender the net present value of interest that would have been received during the loan’s term. Like defeasance, yield maintenance can be disastrously expensive, especially in a falling-rate environment. Borrowers sometimes spend 10% to 20% of a loan or more just to exit a deal. This could significantly impact investor proceeds and returns.
As you compare opportunities, evaluate the syndicator’s business plan, including their proposed capital improvements and renovations. Does their track record give you confidence they can pull this off? And do your projected returns (or the deal’s survival) hinge on their success in this arena?
I can’t tell you how many deals we’ve seen with unrealistic capital improvement and renovation plans. The timing, cost, and projected revenue increases would be tough for pros to accomplish. Yet these plans were proposed by newbies.
Don’t be a sucker for these deals that might work. Is “might” a good place for you to invest your hard-earned capital?
Valuation and Cap Rates
You’re going to buy a residential home for your family, or a rental. How do you estimate its value? You know the answer: checking comps, or comparable properties with similar characteristics in the same area.
Commercial real estate is valued by comps, too, but not in the same direct way as in residential real estate. CRE is typically valued by the income stream it produces for its owners, so when you are thinking of “comps,” you must consider comparable income streams.
What are owners looking for? A return on their investment, or ROI. In CRE, that ROI is typically expressed as a “capitalization rate,” aka cap rate, but there’s more to it than that. The cap rate, in simple math, equals the net operating income divided by the purchase price:
Cap Rate = Net Operating Income ÷ Purchase Price
But what does cap rate represent? It’s not a measure of performance, but rather, a measure of market sentiment. Cap rate gives us a way to numerically quantify how the market values a particular income stream. This is where comps come in.
The cap rate is determined by the sale cap rate from similar properties. Instead of comparing prices, you are comparing cap rates from one income stream (property) to another.
By turning the same formula around (you passed algebra, right?), you’ll get this formula:
Value = Net Operating Income ÷ Cap Rate
This formula basically states that if you know the NOI for a property, the value is determined by dividing that NOI by cap rate. This will produce the market’s opinion on what that NOI is worth. The cap rate is the arbiter of that opinion.
Quick example: Let’s say a property produces an NOI of $100,000 (remember, NOI doesn’t include debt service). If the market determines the cap rate is 5%, the market states that the asset is valued at about $2 million ($100,000 ÷ 0.05). In a less popular market, the buyers may say the cap rate is 7.5%. That market will value that asset at only $1,333,333.
The importance and ubiquity of this formula in commercial real estate cannot be overstated. Furthermore, the formula implies that asset value can be directly increased or decreased by the same percentage as net operating income increases/decreases (other factors being equal).
You may hear the term “forced appreciation.” This is how it’s done.
My fund2 recently invested in an underperforming self-storage property in suburban Las Vegas. The rents on 10 x 10’ units were only $60, and there was high vacancy. The new operator quickly moved to clean and freshen up the facility and soon began raising rents to market levels of about $148 (over a 2.4x increase).
All things being equal, including the operating expense ratio, a 2.4x increase in rents would result in a 2.4x increase in NOI, which would lead to a theoretical 2.4x increase in the property’s value at a constant cap rate. (But if original expenses are held constant, this could provide an even higher NOI!) This increase is great for cash flow, but could provide an even higher return for investors upon sale if debt is utilized.
Does this mean you should try to buy at the highest cap rate possible (meaning the lowest value per unit of income)? That sounds right, but it’s not usually (remember context).
If I buy a “10-cap” (10% cap rate) office building whose tenants are about to vacate permanently, I am paying only $1 million for that $100,000 income stream. But that income is at significant risk and could even go negative, making this an awful deal.
On the other hand, in my self-storage example, I may have acquired that underperforming asset at a “3-cap” (3% cap rate), which most would say is way too pricey. This would value a $100,000 income stream at a lofty $3.33 million.
But if we could, like our operating partner, more than double that net income in short order, I would be quite happy as an investor. This is why I love investing in value-add commercial real estate with an experienced operator. Don’t try this at home—and don’t count on a newbie to pull off a deal like this.
Final Thoughts
I sold my little company to a public firm in the ‘90s. With some cash in hand, I fancied myself a full-time investor. But I was mistaken.
My actions proved I was a speculator, not a true investor. I made a lot of costly mistakes and learned painful lessons that inform my company’s strategy today.
While I won’t detail all of those (check my podcast How to Lose Money), I can tell you one principle that will help you as you evaluate syndications and other real estate investments: Evaluate with the goal of saying no.
I quoted Warren Buffett earlier, who also said, “The difference between successful people and really successful people is that really successful people say no to almost everything.”
You should have the same attitude when evaluating real estate syndications. Start with the assumption that this is a bad investment. And you should seek out proof to confirm this.
This attitude can help you with the very hard task of objectivity. Once the “wanter” in your right brain is activated, once you set your heart on making an investment (or acquiring anything), your left brain will seek to rationalize that opinion. You will seek out facts to help justify your desire and begin to ignore facts or scenarios that contradict your plan.
This attitude is deadly for all types of investors. It entices you to succumb to slick marketing and can cause you to ignore potential pitfalls. It tempts you to ignore facts and rush through due diligence.
It’s better to assume this investment is a no-go and then make the data prove itself to you. Long-time investors know that many of their best decisions were deals they passed on. They’ve traded FOMO (fear of missing out) for FOMU (fear of messing up).
In the end, many live with a happy JOMO (joy of missing out). And they have the predictable passive income and wealth to prove it. It is my hope that you will go and do likewise.